Sarah, an event manager with 15 years of experience, faced a common problem after her latest conference. Despite collecting mountains of data, she couldn’t answer her CEO’s simple question: “Was the event worth our investment?” This story might sound familiar to many event professionals who struggle to measure event success meaningfully.
While most event platforms track dozens of metrics, knowing which ones truly matter makes the difference between data overload and actionable insights. This guide focuses on 10 specific metrics that answer your most pressing questions about event performance, attendee satisfaction, and financial impact.
These measurements work for both virtual and in-person events, though their application might vary slightly between formats. They’re selected based on conversations with hundreds of event managers about which numbers actually help them improve their events and justify their budgets.
Why These 10 Metrics Stand Out
When choosing which metrics to track, many event managers fall into one of two traps. They either track too little data, missing crucial insights, or they track everything possible, creating a maze of numbers that leads nowhere. The metrics in this guide strike a balance between comprehensive coverage and practical utility.
These particular measurements earned their spots on our essential list because they:
- Provide clear answers about event success
- Help predict future event performance
- Guide specific improvements
- Support budget discussions with stakeholders
- Work across different event types and sizes
Each metric serves multiple purposes while remaining simple enough to track consistently. They complement each other, working together to create a complete picture of your event’s performance without overwhelming you with unnecessary data.
Think of these metrics as your event’s vital signs. Just as a doctor checks specific measurements to assess your health, these numbers reveal your event’s strengths and potential problems. They alert you to issues early enough to make corrections and help you replicate successes in future events.
Net Promoter Score (NPS)
Your event’s Net Promoter Score acts as the ultimate word-of-mouth metric. This single number tells you how likely attendees are to recommend your event to others – perhaps the most meaningful measure of event satisfaction.
To calculate NPS, ask attendees: “On a scale of 0-10, how likely are you to recommend this event to a colleague?” The formula subtracts the percentage of detractors (scores 0-6) from the percentage of promoters (scores 9-10).
Most successful events score between +30 and +50. Anything above +50 signals outstanding performance, while scores below +30 suggest room for improvement. Professional conferences typically aim for +40, while training events often target +45.
The real value of NPS comes from tracking it across events and understanding what drives changes in your score. A rising NPS often predicts growing attendance at future events, while a falling score warns of potential problems with your event format or content.
Session Completion Rates
Session completion rates reveal how well your content holds attention. This metric matters because it shows which sessions actually deliver value, not just which ones attract initial interest.
For virtual events, track both how many people start each session and how many stay until the end. For in-person events, use room counts at different times during each session. Look for completion rates above 80% – lower numbers often indicate problems with session length, content quality, or speaker engagement.
Watch for patterns in sessions with high completion rates. They often share common elements like interactive components, well-structured content, or particular speakers. Use these insights to improve future session planning and speaker selection.
The 10 Essential Metrics
1. Net Promoter Score (NPS)
Your event’s Net Promoter Score acts as the ultimate word-of-mouth metric. This single number tells you how likely attendees are to recommend your event to others – perhaps the most meaningful measure of event satisfaction.
To calculate NPS, ask attendees: “On a scale of 0-10, how likely are you to recommend this event to a colleague?” The formula subtracts the percentage of detractors (scores 0-6) from the percentage of promoters (scores 9-10).
Most successful events score between +30 and +50. Anything above +50 signals outstanding performance, while scores below +30 suggest room for improvement. Professional conferences typically aim for +40, while training events often target +45.
2. Session Completion Rates
Session completion rates reveal how well your content holds attention. This metric matters because it shows which sessions actually deliver value, not just which ones attract initial interest.
For virtual events, track both how many people start each session and how many stay until the end. For in-person events, use room counts at different times during each session. Look for completion rates above 80% – lower numbers often indicate problems with session length, content quality, or speaker engagement.
Watch for patterns in sessions with high completion rates. They often share common elements like interactive components, well-structured content, or particular speakers. Use these insights to improve future session planning and speaker selection.
3. Revenue Per Attendee (RPA)
Revenue per attendee shows the financial value each participant brings to your event. Calculate it by dividing total event revenue by the number of attendees. Include all revenue streams: ticket sales, sponsorships, merchandise, and additional purchases.
Average RPA varies significantly by industry and event type. Trade shows might see $500-1000 per attendee, while professional conferences often range from $800-2000. Track your RPA trends over time – steady increases suggest growing event value, while decreases warrant investigation into pricing strategy or value proposition.
4. Cost Per Acquisition (CPA)
CPA measures how much you spend to attract each attendee. Calculate it by dividing your total marketing and promotional costs by the number of registered attendees. This metric helps optimize your marketing budget and identify your most cost-effective promotional channels.
Healthy CPA ranges typically fall between 15-25% of ticket price. If you’re spending more, examine your marketing mix. Some channels might cost more initially but bring higher-value attendees. For example, social media ads might have a lower CPA but attract fewer decision-makers than targeted industry publications.
Track CPA by marketing channel. Email marketing to past attendees often shows the lowest CPA ($5-15 per registration), while paid advertising might range from $30-100 per registration. Use these insights to allocate your marketing budget more effectively.
5. Engagement Time Distribution
This metric tracks how attendees spend their time during your event. Rather than looking at simple attendance numbers, measure active participation time across different event elements – sessions, networking, exhibits, or interactive features.
Create an engagement map showing where attendees spend most of their time. Look for:
- Peak engagement periods
- Drop-off points
- Popular activity combinations
- Underutilized features
For example, a business conference found that morning sessions had 30% higher engagement than afternoon sessions, but afternoon workshops saw 40% more participation than morning ones. This led them to restructure their schedule, placing passive learning sessions in the morning and interactive workshops in the afternoon.
Success looks different for each event type. Industry conferences typically aim for 6+ hours of active engagement per day, while virtual events might target 4+ hours. The key is tracking trends and patterns rather than focusing on absolute numbers.
6. Conversion Rate Timeline
Conversion rate timeline tracks how attendee commitment develops throughout your event cycle. This metric matters because it shows where potential attendees hesitate or drop off, helping you identify and fix problems in your registration process.
Start tracking from first contact through post-event actions. Standard benchmarks include:
- Email to website visit: 25-35%
- Website visit to registration start: 15-20%
- Registration start to completion: 80-85%
- Registration to attendance: 85-90%
Many medical conferences have improved their conversion rates significantly by simplifying their registration process. Streamlining the initial registration and collecting detailed information later often leads to 15-20% higher completion rates. They found that requiring too much professional information upfront discouraged sign-ups. By streamlining the initial registration and collecting detailed information later, they significantly improved their conversion rate.
7. Speaker Performance Metrics
Speaker effectiveness directly impacts attendee satisfaction and learning outcomes. Create a composite score combining:
Average session ratings don’t tell the whole story. Break down speaker performance into specific components:
- Content relevance: How well the material met attendee needs
- Presentation skills: Clarity, pace, and audience engagement
- Q&A quality: Meaningful answers and discussion facilitation
- Follow-up resource usage: Downloads of presentation materials
Top performers typically score above 4.2 on a 5-point scale across all categories. Consider these scores when inviting speakers back. One technology conference found that speakers scoring above 4.5 consistently drew 30% larger audiences in subsequent events.
8. Networking Success Rate
Measure the effectiveness of your networking opportunities through actual connections made. Calculate this by tracking:
- Number of scheduled meetings completed
- Quality of connections (measured through post-event surveys)
- Follow-up actions taken
- Business cards or contact information exchanged
Successful business events typically see 5-8 meaningful connections per attendee per day. Virtual events might target 3-5 quality connections per attendee. Research shows that attendees who make six or more meaningful connections during an event are substantially more likely to return in subsequent years.
9. Content Consumption Patterns
This metric reveals which content formats and topics resonate most with your audience. Track:
- Live session attendance vs. recordings viewed
- Document download rates
- Resource access timing
- Topic popularity across different attendee segments
Industry data shows that hands-on workshop recordings typically receive 2-3 times more views than keynote recordings, despite often having lower live attendance numbers. This insight led them to adjust their content strategy, offering more practical, skill-based sessions in future events.
Pay attention to when attendees access content. Many events find that presentation slides see peak downloads during sessions, while detailed guides get more attention in the weeks following the event.
10. ROI Formula for Events
Your Return on Investment formula should capture both immediate and long-term value. The basic calculation divides total returns by total costs, but effective ROI tracking requires more detail:
Immediate Returns:
- Direct revenue from registrations
- Sponsorship income
- On-site purchases
- Partnership deals closed
Long-term Value:
- Lead value (average deal size × conversion rate)
- Member retention impact
- Brand awareness increase
- Market position improvement
Professional associations typically see ROI multipliers between 3x and 5x when factoring in both direct revenue and long-term member value.
Successful events typically target an ROI between 25-34% for first-time events, rising to 50-100% for established events. Regular tracking helps identify opportunities to improve this return through better cost management or revenue optimization.
Practical Implementation
Successful metric tracking starts with proper planning and the right tools. Before your event begins, establish your measurement framework through these key steps:
Set up consistent data collection methods across all platforms. For virtual events, ensure your event platform captures attendance, engagement, and interaction data automatically. For in-person events, combine digital check-ins with manual counting for comprehensive coverage.
Timing matters in data collection. Schedule automatic data pulls at key moments throughout your event. Morning and afternoon counts often catch different patterns in attendance and engagement. Post-session surveys work best when sent within an hour of session completion.
Create standardized reporting templates that track these metrics consistently. This helps identify patterns across different events and makes year-over-year comparisons meaningful. Update your templates quarterly to reflect new tracking capabilities or changing event needs.
Common Measurement Challenges
Even experienced event managers face obstacles when tracking metrics. Here’s how to address common challenges:
Missing Data Points: When attendance scanning fails or survey responses run low, fill gaps through alternative measurements. Session photos can provide rough attendance counts. Social media engagement can indicate session popularity when direct measures aren’t available.
Platform Integration Issues: Most events use multiple platforms that don’t automatically share data. Create a central dashboard that pulls key metrics from each platform daily. This prevents data silos and gives you a complete view of event performance.
Resource Constraints: Small teams often struggle to track everything. Focus on automating essential metrics first. Start with registration tracking and attendee feedback, then expand your measurement program as resources allow.
Future-Proofing Your Metrics
Event measurement continues to evolve with technology. Privacy regulations increasingly impact data collection methods. Plan ahead by:
- Building opt-in data collection into registration
- Using aggregate metrics when possible
- Focusing on quality over quantity in data collection
- Testing new measurement tools between events
Keep your measurement strategy flexible. New metrics emerge as event formats evolve. Virtual and hybrid events often require different success measures than traditional in-person gatherings.
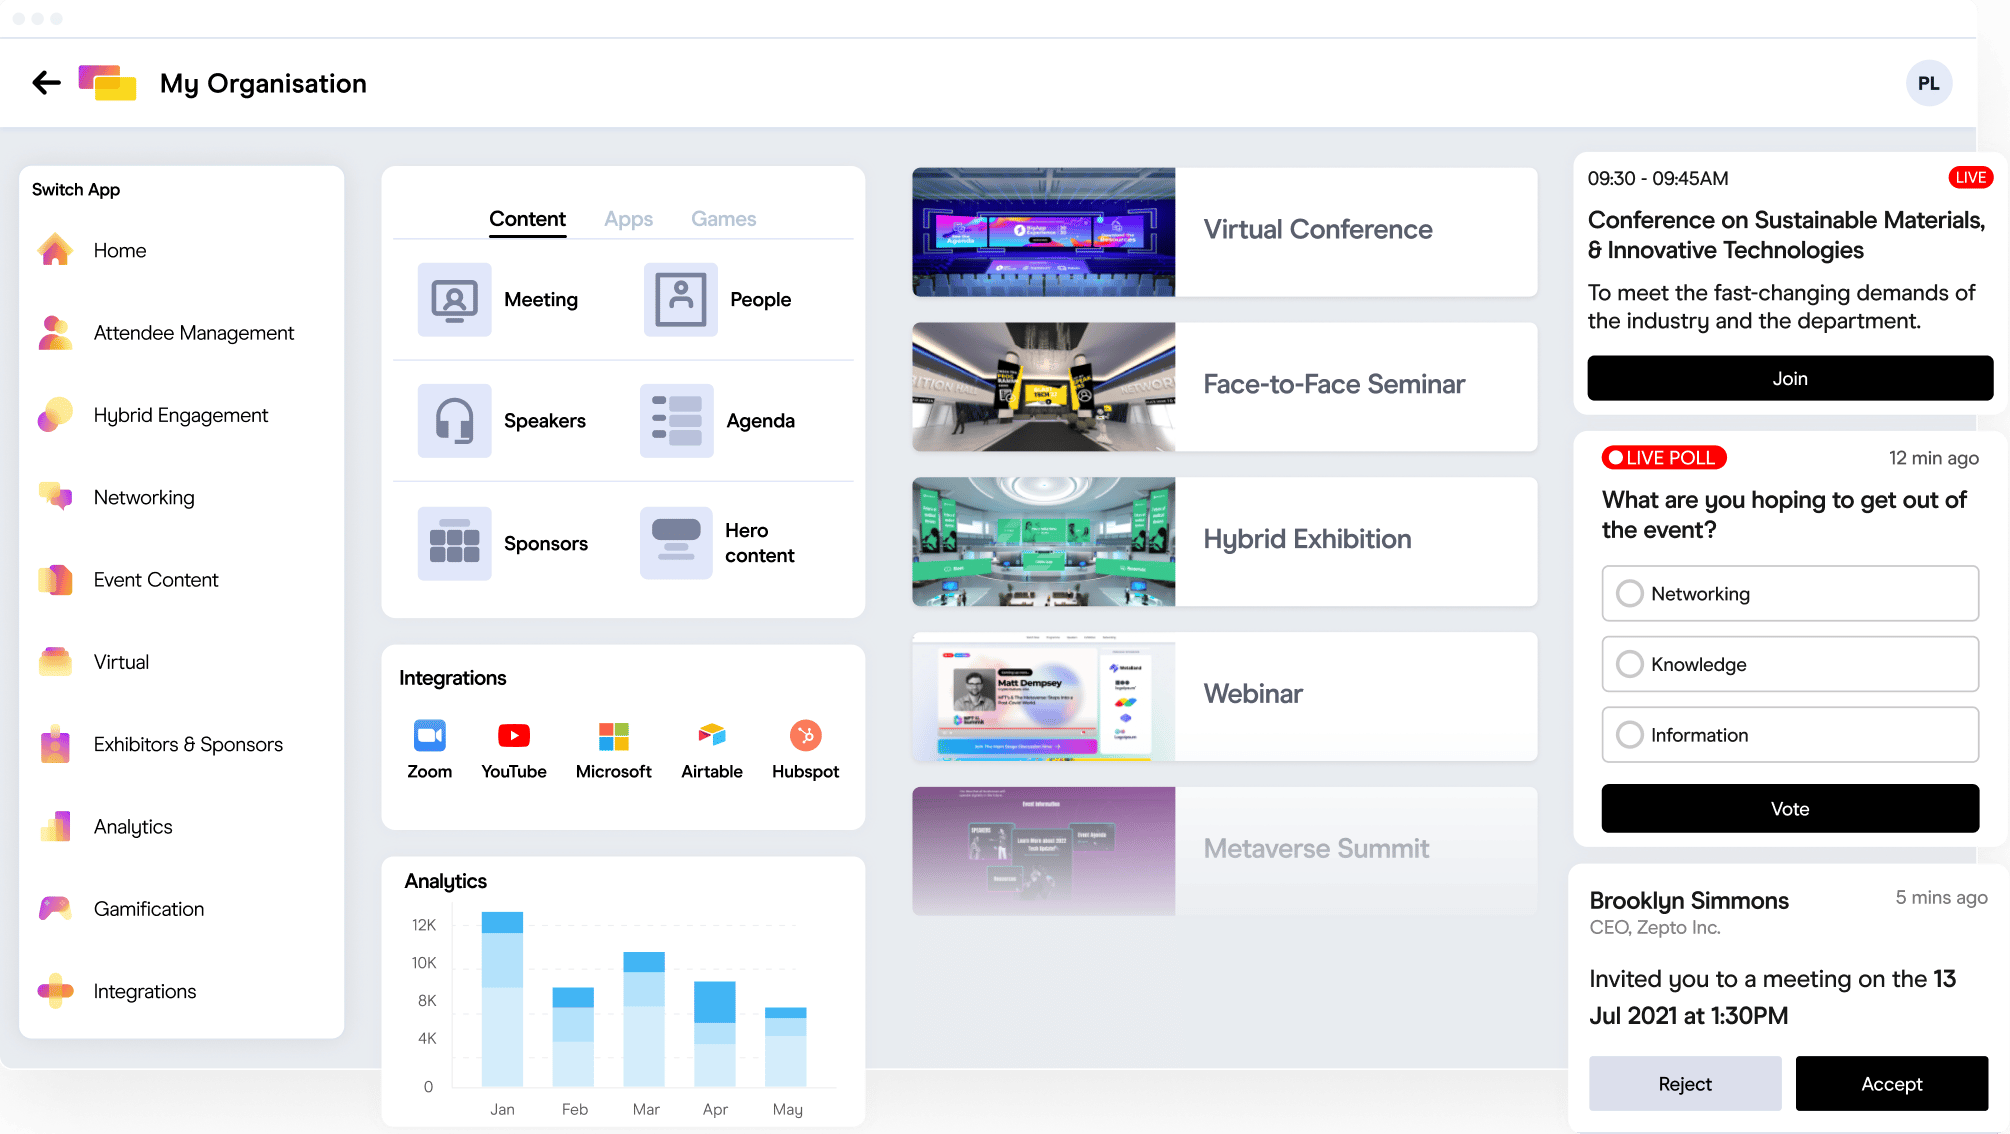
Managing these essential metrics becomes straightforward with Gevme’s analytics suite. Our platform automatically tracks and analyzes all ten critical metrics, providing real-time insights through customizable dashboards.
Gevme simplifies post-event data analysis by:
- Automating data collection across all event touchpoints
- Generating instant visual reports for stakeholders
- Tracking trends across your entire event portfolio
- Providing actionable recommendations for improvement
Ready to streamline your event analytics? Visit Gevme today to see how our platform can enhance your measurement strategy and improve your event outcomes. Request a demo


