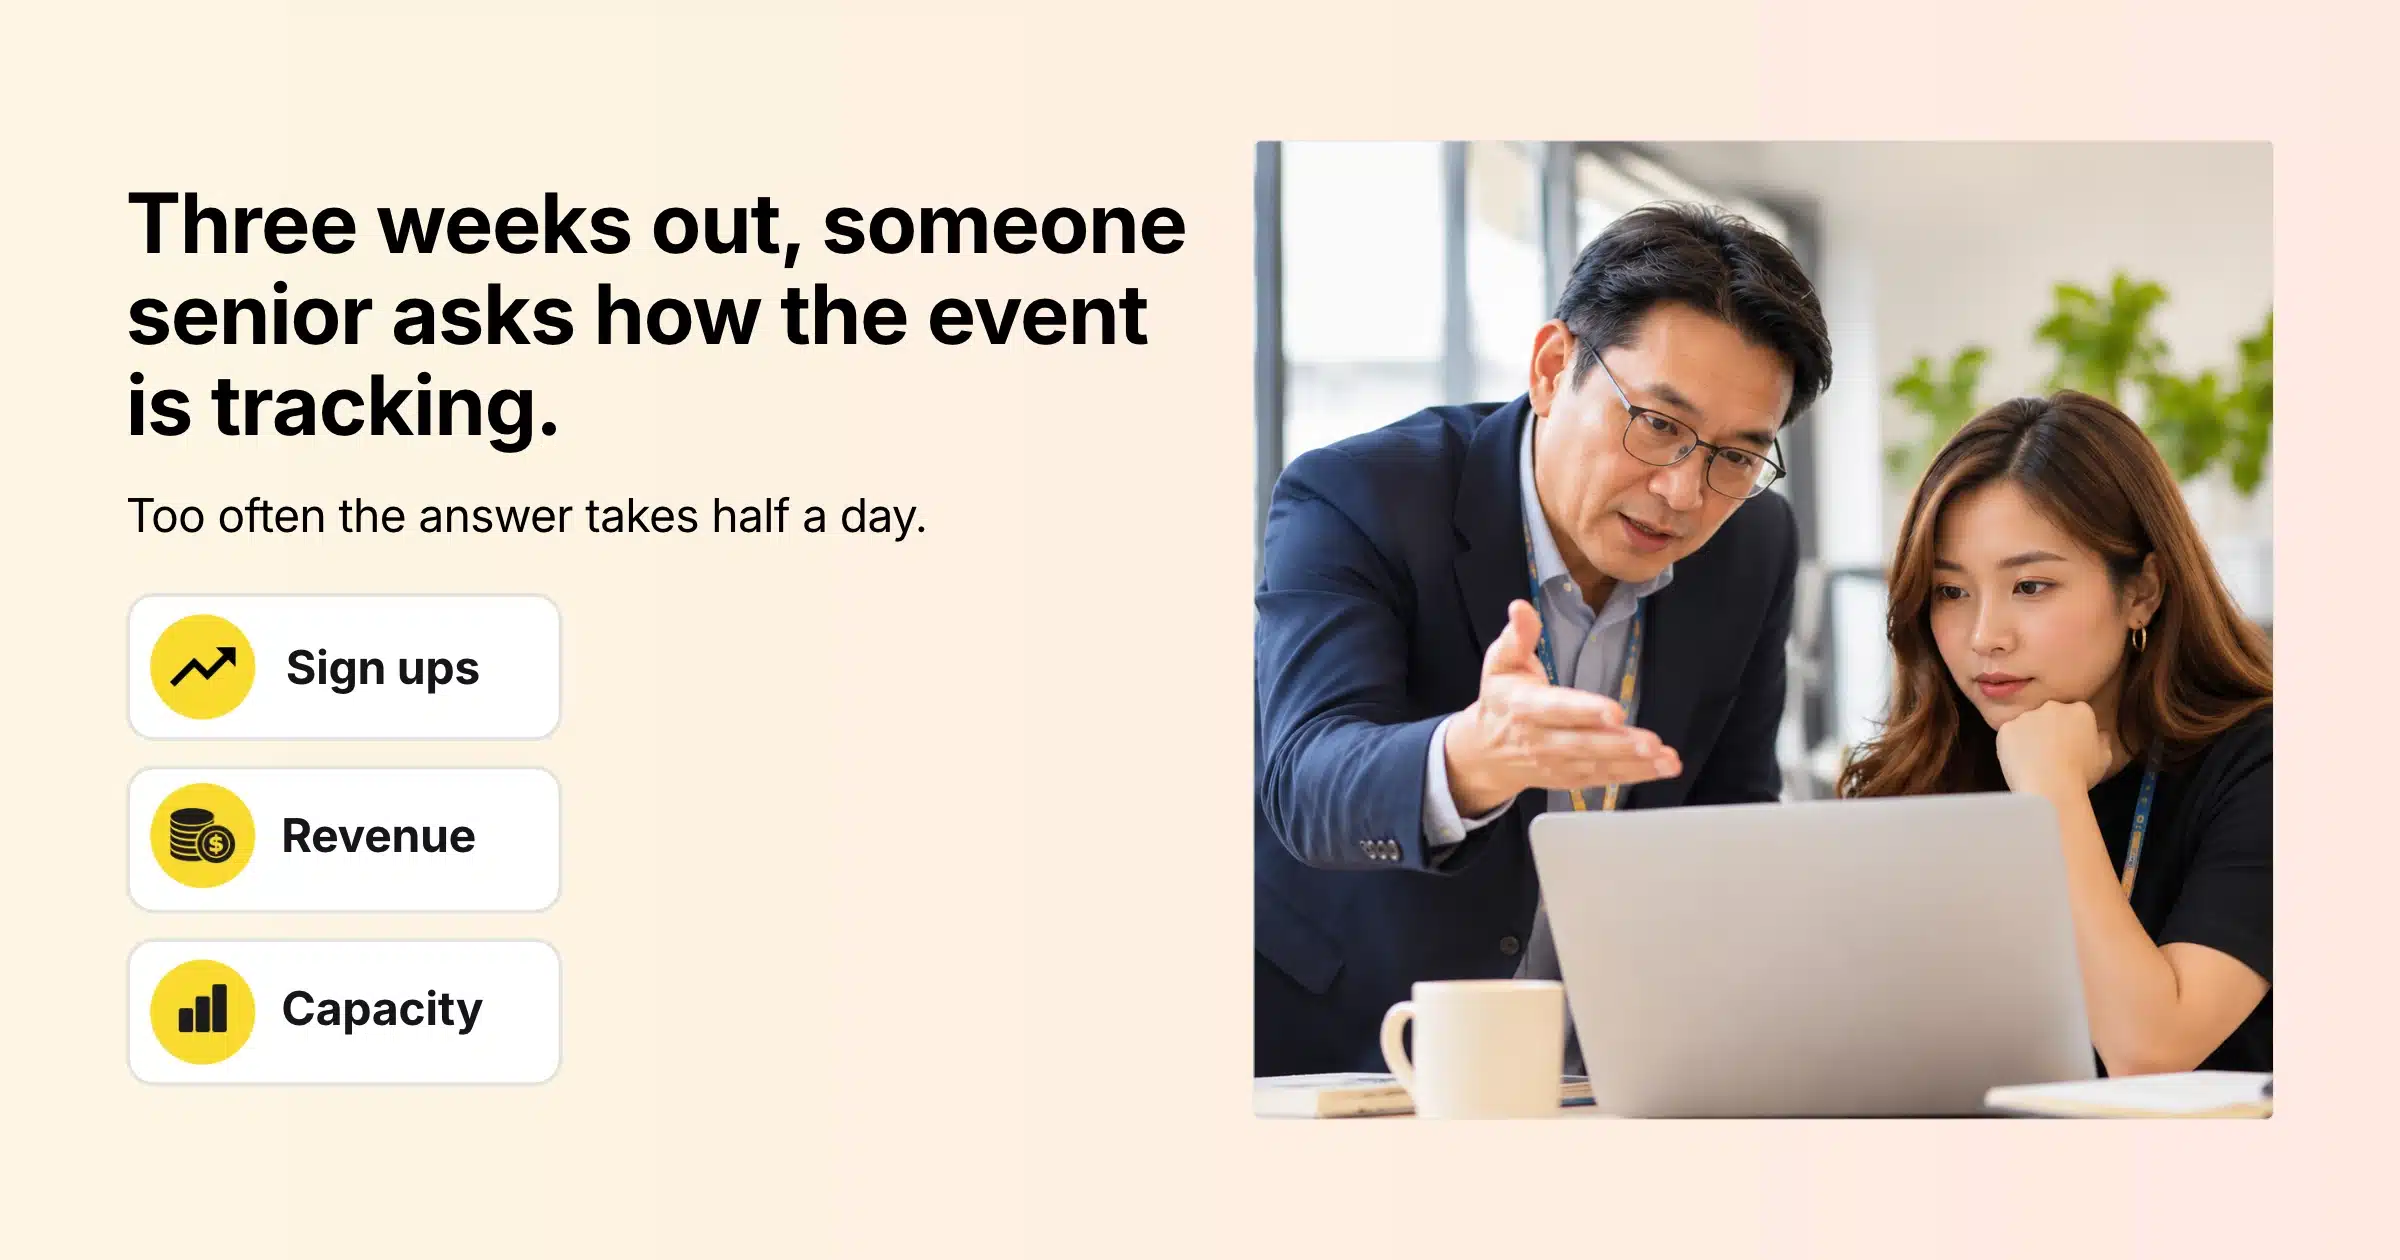
Three weeks before a conference, someone senior asks a simple question: “How are we tracking?” Too often the answer takes half a day. One person exports orders, another counts ticket types in a spreadsheet, finance sends a separate payments file, and by the time the numbers line up, they are already out of date.
An event dashboard is a single view of your registration numbers: how many people have signed up, how much revenue has come in, how close each ticket type is to selling out, and, on the day, how many people have checked in. A real time dashboard updates as registrations arrive, so the answer to “how are we tracking?” is always one click away. It turns registration data from a weekly report into something you can act on while there is still time to change the outcome.
This guide covers the numbers worth watching at each stage of an event, how to read them, what to do when they move, and how to track sign ups, revenue and capacity in Gevme Registration using event reports, global reports, smart lists and the BI Dashboard.
Key Takeaways
- Track three groups of numbers on your event dashboard: sign ups, revenue and capacity, then add check-ins once the doors open.
- Set a target for each number before sales open, so the dashboard tells you whether you are ahead or behind, and by how much.
- Watch the pace of daily sign ups more closely than the running total, because a slowing pace is the earliest warning you will get.
- In Gevme Registration, save your column choices, filters and up to five aggregations on each report, so the whole team sees the same numbers.
- Use event capacity and ticket quantities to stop overselling, and check remaining places by ticket type at least once a week.
- Use Global Reports for totals across all your events, and the BI Dashboard for live sign up and check-in tracking.
- Agree in advance what each warning sign triggers, such as a promo campaign, a capacity increase or an extra check-in counter.
Why a Real Time View Changes Decisions
Registration numbers are only useful while you can still act on them. If you learn on the Friday before the event that the workshop track is half empty, there is very little you can do. If you see the pace slowing four weeks out, you can send a targeted email, ask speakers to share the event, or move budget into paid promotion.
A live view also removes arguments about whose numbers are right. When sales, marketing and finance all look at the same dashboard, the conversation moves from “my spreadsheet says 812” to “we are 60 sign ups behind target, so what do we do?”
Finally, a dashboard protects your capacity. Venues, catering and badge stock all have hard limits. Seeing remaining places by ticket type in one view means you close a ticket on time, open a waiting list before people start complaining, or negotiate extra space while the venue can still offer it.
The Numbers Worth Watching at Each Stage
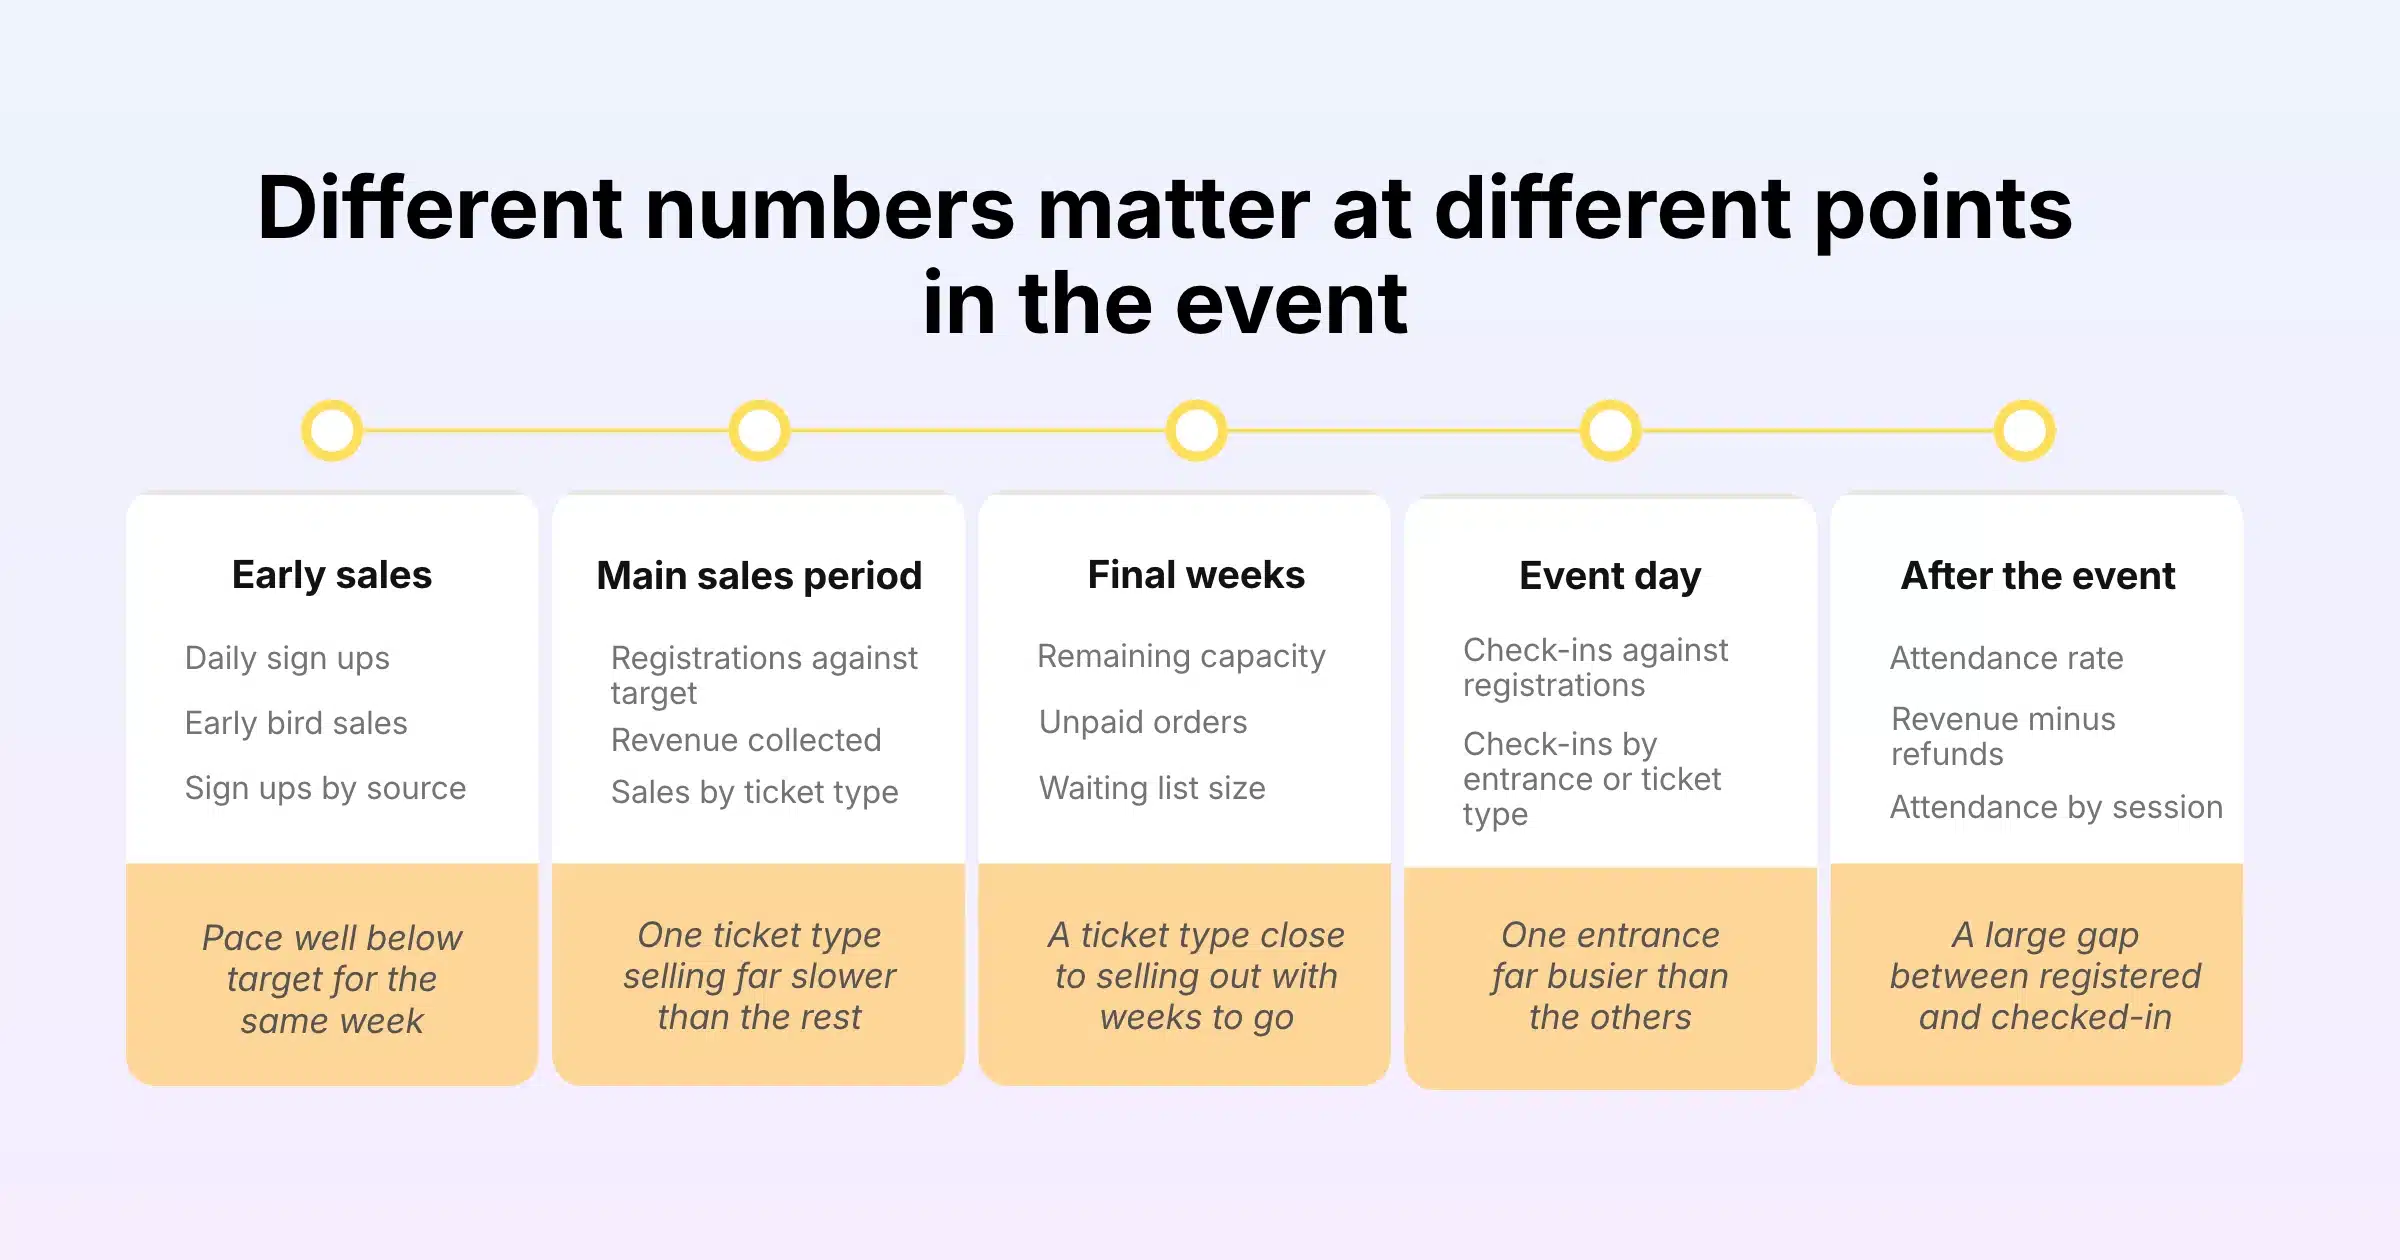
Different numbers matter at different points in the event. This table gives a simple structure for your dashboard.
| Stage | Numbers to watch | What a warning looks like |
|---|---|---|
| Early sales (first weeks) | Daily sign ups, early bird sales, sign ups by source | Pace well below your target for the same week |
| Main sales period | Total registrations against target, revenue collected, sales by ticket type | One ticket type selling far slower than the rest |
| Final weeks | Remaining capacity, unpaid orders, waiting list size | A ticket type close to selling out with weeks still to go |
| Event day | Check-ins against registrations, check-ins by entrance or ticket type | One entrance far busier than the others |
| After the event | Attendance rate, revenue minus refunds, attendance by session | A large gap between registered and checked-in numbers |
Sign Ups
Start with three views: the running total, the number of new sign ups each day, and sign ups by ticket type. The running total tells you where you are. The daily number tells you where you are heading. Ticket type tells you which audience is responding.
Add source when you can. If every order carries a UTM value from the link that brought the buyer in, you can see which email, partner or ad campaign is working, and put more effort behind it.
Revenue
Revenue on a dashboard should separate money collected from money still owed. Paid orders, unpaid orders waiting on bank transfer or invoice, and refunds each tell a different story. A conference can look healthy on registrations and still be short on cash if a large share of corporate buyers have not paid their invoices yet.
Capacity
Capacity has two levels: each ticket type has its own limit, and the event as a whole has an overall limit. Watch both. A sold-out VIP tier is good news. A sold-out event with half the workshop seats unused usually means the limits were set wrong.
Check-Ins
Once the doors open, the dashboard switches from sales to operations. Check-ins against registrations show how many people are still to arrive. Check-ins by entrance or ticket type show where to move staff. After the event, the attendance rate (checked in divided by registered) is one of the clearest measures of how well your reminders and communication worked.
Set Targets Before You Open Sales
A number without a target is hard to read. 400 registrations could be a great result or a worrying one, depending on what you planned.
Before sales open, set three things for each ticket type: the total you need, the date you need it by, and a rough weekly pace. Past events are the best guide. If last year’s conference reached 30% of its final total by the end of early bird, you can use that as a checkpoint this year.
Write the targets somewhere the whole team can see them, and review the dashboard against them on the same day each week. A short weekly check, with the same numbers in the same order, catches problems faster than a long monthly review.
Tracking Sign Ups, Revenue and Capacity in Gevme Registration
Gevme Registration gives you several views of the same live data, each suited to a different job. This table shows where to look for each number.
| What you want to know | Where to find it in Gevme | What it shows |
|---|---|---|
| Total tickets and their value | Reports, Tickets tab | Every ticket issued, with the total ticket price at the top right |
| Paid orders | Reports, Orders tab, Orders Listing | Completed (fully paid) orders |
| Who bought for whom | Orders tab, Orders and Attendees Listing | Completed orders with each attendee’s details |
| Money in, online and offline | Orders tab, Transactions | Every payment transaction received |
| Registered and checked in | Reports, Attendees tab, Participation | All registered attendees, with the checked-in count at the top right |
| Merchandise and add-on stock | Reports, Merchandise tab | Sales amount, used quantity and balance for each item |
| Totals across all events | Global Reports | Orders, transactions, attendees, events and users across the organisation |
| Live sign up and check-in trends | BI Dashboard | Daily sign ups, live tracking by segment, check-in trend, entrances |
Event Reports
Open your event and click Reports, under the Manage section of the left-hand navigation. The report categories sit in tabs across the top: Tickets, Orders, Survey, Attendees and Merchandise. The Tickets report loads first.
Each report can become a dashboard tile of its own. Click the settings icon at the top right of the report to:
- choose which columns appear and in what order
- set the default sort
- add filters, and combine several conditions with a filter pattern such as (1 and 2) or 3
- set how many rows appear per page
- add up to five aggregations, the headline numbers that appear at the top right of the report
Aggregations are where a report starts to behave like a dashboard. There are eight operations to choose from: Sum, Average, Max, Min, Count of Rows, Count of Unique Values, Count of Non-Empty Values and Count of Empty Values. On the Tickets report, a Sum of ticket price gives you gross ticket revenue. On the Participation report, a Count of Unique Values on the company field shows how many organisations are sending people, even when one company registers several attendees.
Saved settings stay in place when you leave and return, and they apply to every user who opens that report. Set up the reports once, and the whole team sees the same columns, filters and headline numbers. For a quick one-off question, use the quick filter instead: pick a column, an operator and a value, and the filter clears the next time you refresh. The full steps are in the customising a report guide.
Event reports cache their data for one hour from the moment a report is first generated, which keeps them fast for everyone who opens or filters the same report. After the hour, Gevme pulls fresh data automatically. For minute-by-minute tracking during a busy launch or on the event day, use the BI Dashboard described below.
Smart Lists for Live Segments
Smart lists are saved searches on your attendee, order or contact grid. Run a search, such as everyone holding a Workshop ticket, then click “Save search as smart list”. From then on, the list updates by itself as new records match the criteria.
Smart lists are useful dashboard building blocks. Create one for each ticket type, one for unpaid orders, and one for attendees from your priority industries, and you can open any of them from the list selector at the top left of the grid to see the current count. They also double as audiences for email campaigns, so the segment you are watching is the segment you can contact.
Global Reports Across Every Event
When you run more than one event, Global Reports give you totals across the whole organisation:
- Global Orders: the total amount collected and the sum of refunds.
- Global Transactions: collected and refunded amounts for each transaction.
- Global Attendees: registered attendees, checked-in attendees, unique attendees and unique events.
- Users and login reports: who has access to your account and when they last logged in.
Event-level fields show up in Global Reports when they are created as Predefined Fields. If you give the same field, such as Industry or Job Level, the same predefined name across your events, you can compare those segments across your whole programme in one report.
Global Reports appear for users whose role allows them, so leadership can see organisation-wide revenue while event staff see only their own events. The global report guide lists each section.
The BI Dashboard for Live Tracking
For events where every hour counts, Gevme’s Business Intelligence (BI) Dashboard tracks sign ups and check-ins in real time. It includes four views:
- Pre-Event Daily Sign-Up Tracking: sign ups per day, so you can see trends and slowdowns.
- Pre-Event Live Tracking by Segments: sign ups broken down by the data you collect, such as ticket type or attendee category.
- Onsite Check-Ins Trend: the flow of arrivals through the day, for crowd and staffing decisions.
- Onsite Live Tracking by Tickets or Entrances: progress at each gate or ticket type, so you can act quickly when one area backs up.
The BI Dashboard is set up for your event by the Gevme team. Contact sales@gevme.com to add it. It suits large conferences, trade shows and multi-day events where the operations team needs a live screen in the control room.
Keeping Capacity Under Control
Capacity tracking works best when the limits are built into the registration itself, so the dashboard reports on rules you have already set.
Ticket quantities. Give each ticket type a maximum quantity that matches the real limit behind it: workshop seats, gala dinner covers or VIP lounge space.
Event capacity. Set an overall event capacity that matches your venue or catering number. In Gevme, event capacity overrides individual ticket quantities, and registration closes when the combined total is reached. Your ticket limits can add up to more than the venue holds, and the event will still never oversell.
Sales periods and visibility. Give early bird tickets a closing date, and set tickets to hide automatically when they are not on sale. The registration page stays tidy, and your dashboard stops counting an early bird tier that should already be closed.
Waiting lists. When a ticket sells out, a waiting list keeps demand visible. You release places manually, and Gevme emails the next people on the list a link to register, with an optional expiry time. A long waiting list is a strong case for asking the venue for more space.
Merchandise and add-ons. If you sell workshops, dinners or merchandise as add-ons, the Merchandise Sales and Inventory report shows sales, used quantity and balance for each item, so you know when an add-on is about to run out.
Reading Revenue the Right Way
Revenue numbers can mislead if you read only the headline. Look at four figures together:
- Gross ticket value from the Tickets report, with a Sum aggregation on price.
- Money collected from the Transactions report, which lists online and offline payments.
- Unpaid orders, such as bank transfers and invoices not yet settled. Gevme sends an acknowledgement email to unpaid orders 15 minutes after registration, and you can move orders to Completed Payment once the money arrives.
- Refunds, which Global Orders and Global Transactions total for you.
For finance, the Orders Listing is filtered to completed orders by default, so it shows only fully paid orders. When you reconcile at the end of the event, export both completed and cancelled orders, so refunded orders are counted too.
If you use a payment gateway, connect it through Gevme’s payment gateway integrations so card payments flow straight into your transaction records without manual entry.
Tracking Where Sign Ups Come From
Knowing that registrations are up is useful. Knowing why is better. Gevme Registration stores UTM and source values with each order and integrates with Google Analytics and Google Tag Manager, so every registration can be traced back to the campaign that drove it. A confirmation page data layer lets you count completed registrations as conversions in your ad accounts.
Email campaigns sent from Gevme report opens, clicks, bounces, unsubscribes and registrations from each campaign. Partner-linked promo codes track registrations per partner. Put those numbers next to your daily sign ups, and you can see which push moved the line.
If your event website runs on Gevme Omnichannel, the event website analytics add visits, unique visitors, active visitors in the last 15 minutes, time spent, locations and devices. A spike in visits with no matching rise in sign ups usually points to a problem on the registration page itself.
Event Day: From Sales Dashboard to Operations Screen
On the day, the most useful numbers are about people moving through the doors. Every check-in at a Gevme onsite counter, kiosk or phone is recorded with a timestamp, and the Participation report shows the checked-in count at the top right. Session check-in records arrivals at individual rooms or workshops, so you can see which sessions drew the biggest crowds.
With the BI Dashboard, the check-in trend and live tracking by entrance turn those records into a screen your operations lead can watch all day. If one entrance builds a queue, you can open another counter or redirect walk-ins before the line gets long.
GovInsider Festival of Innovation 2025 ran for more than 1,200 attendees with self-check-in kiosks and session tracking on Gevme, so the team could follow arrivals and session attendance as the day unfolded.
A Weekly Dashboard Routine
A dashboard only helps if someone reads it on a schedule. This routine takes about 20 minutes a week.
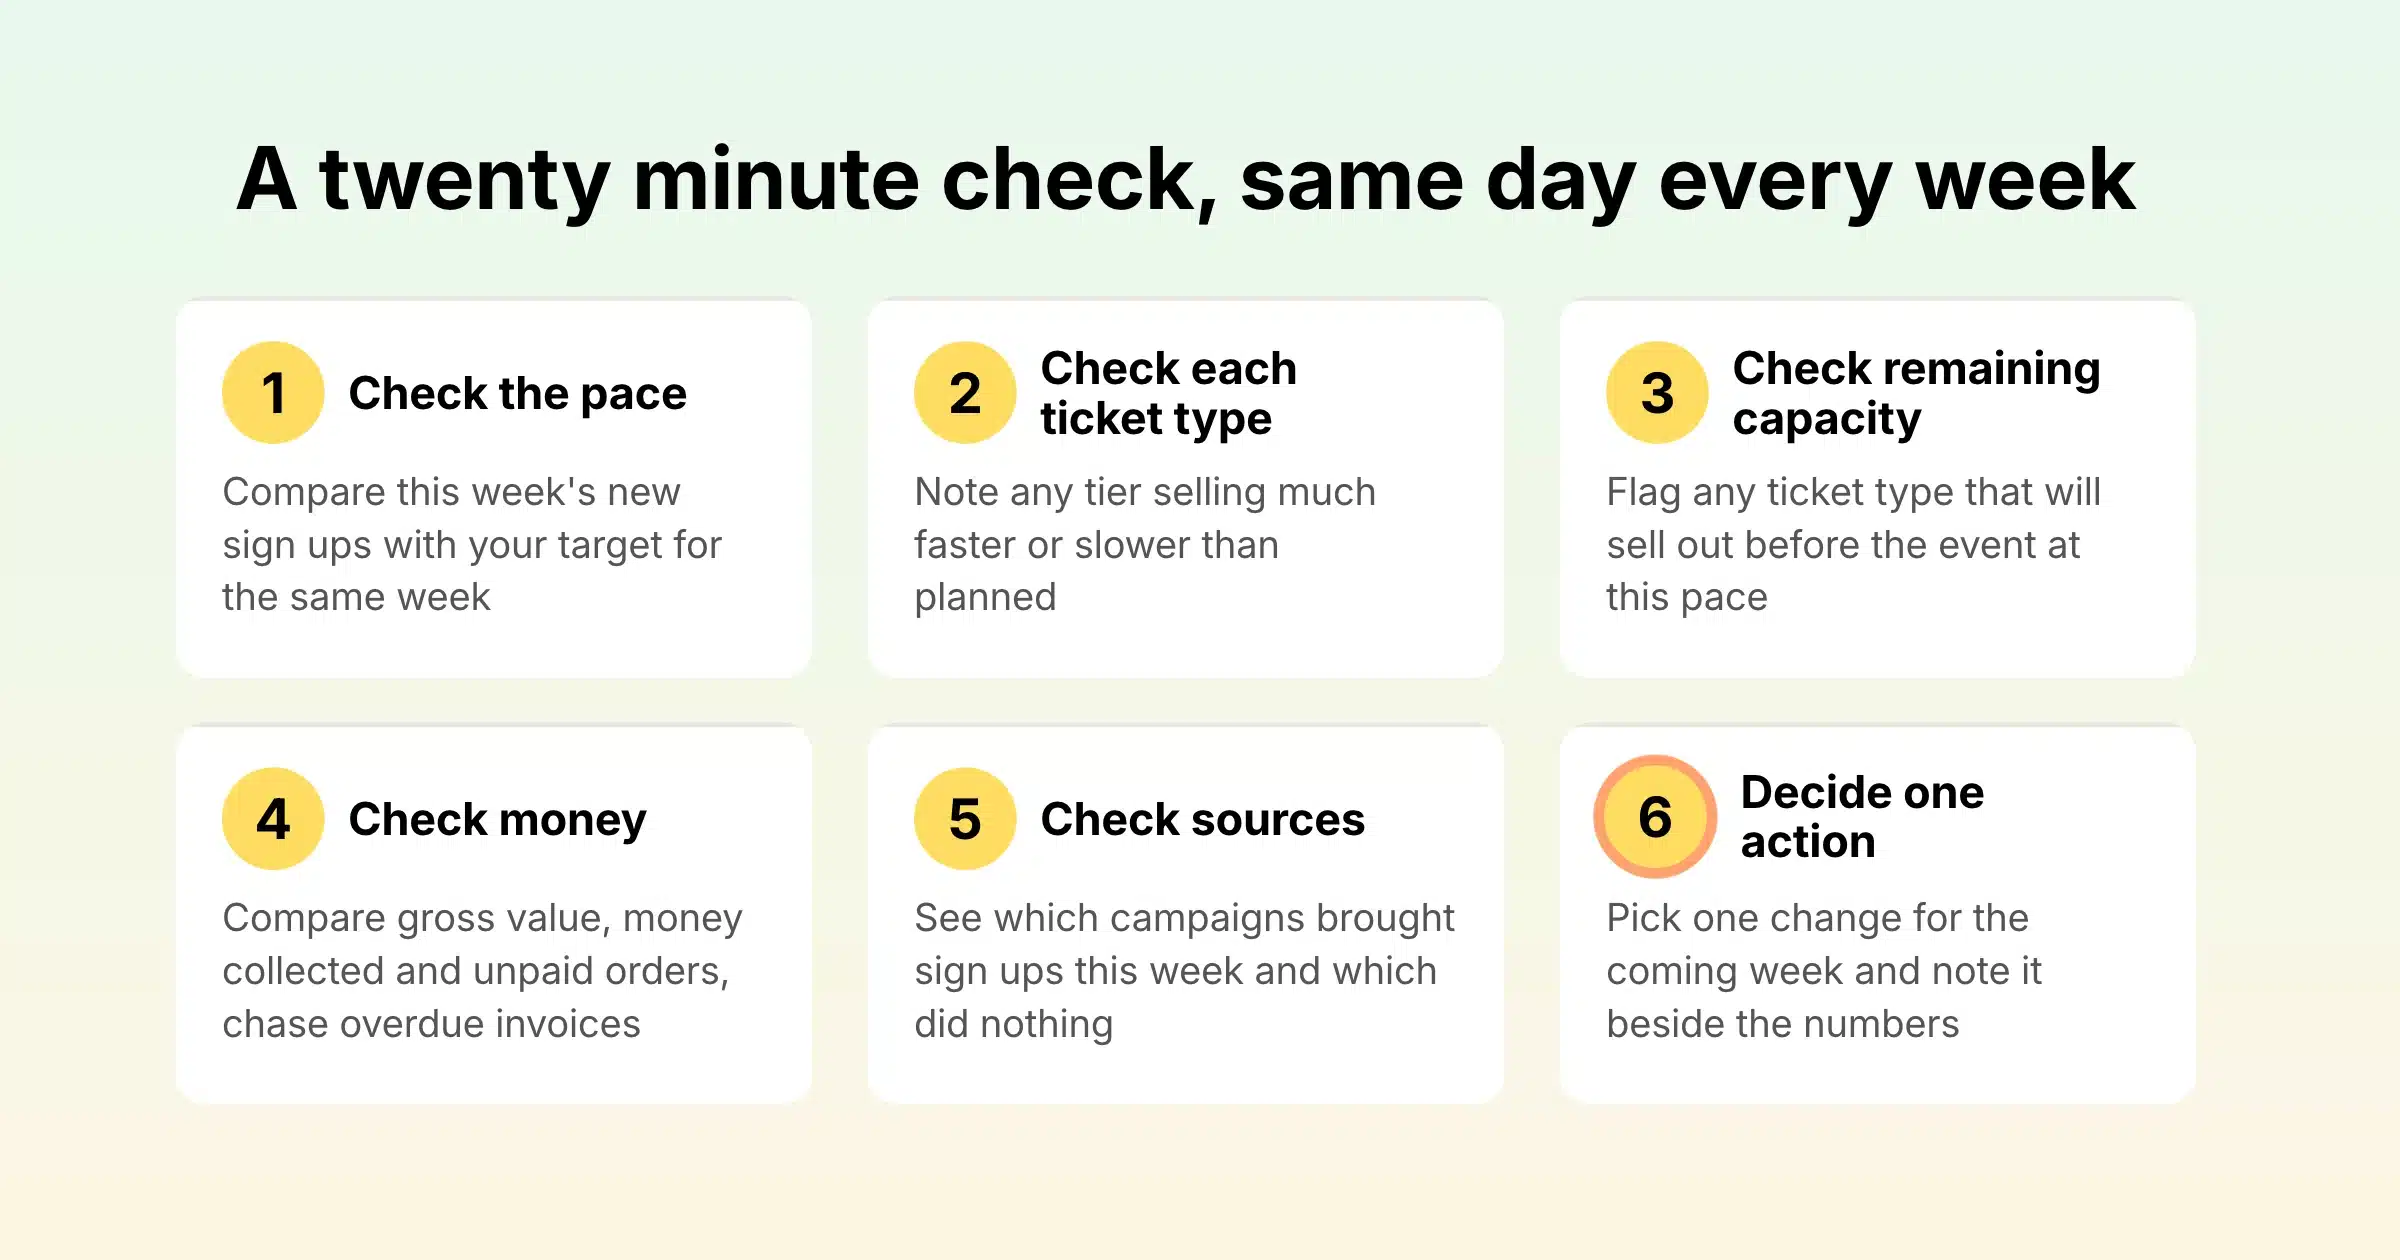
- Check the pace. Compare this week’s new sign ups with your target for the same week.
- Check each ticket type. Note any tier selling much faster or slower than planned.
- Check remaining capacity. Flag any ticket type that will sell out before the event at the current pace.
- Check money. Compare gross value, money collected and unpaid orders, and chase overdue invoices.
- Check sources. See which campaigns brought in sign ups this week, and which did nothing.
- Decide one action. Pick one change for the coming week, such as a promo code, a reminder campaign or a capacity request, and note it beside the numbers.
A Few Terms Worth Knowing
- Aggregation: a headline number calculated from a report, such as a total, an average or a count of unique values.
- Smart list: a saved search that keeps updating as records match or stop matching its criteria.
- Attendance rate: the share of registered attendees who checked in, usually shown as a percentage.
- UTM parameters: tags added to a link that tell your reports which campaign or channel a visitor came from.
Pro Tip
Build your dashboard before the first ticket goes on sale, using a test event if you need to. Set up the report columns, filters and aggregations, create a smart list for each ticket type and for unpaid orders, and write your weekly targets next to them. On launch day you will be watching the numbers that matter, and you will not lose the first, busiest week of sales to setting up reports.
Frequently Asked Questions
An event dashboard is a single view of the key numbers for an event: registrations, revenue, remaining capacity and, on the day, check-ins. A real time dashboard updates as new registrations and check-ins come in, so the team can act on the numbers while there is still time to change the outcome.
An event registration dashboard should show total registrations against target, daily sign ups, sales by ticket type, revenue collected, unpaid orders, refunds and remaining capacity. On the event day, add check-ins against registrations and check-ins by entrance or session.
Yes. Gevme’s BI Dashboard tracks daily sign ups, live segments, check-in trends and entrances in real time, and smart lists update as new records match their criteria. Event reports cache their data for an hour after first being generated, then refresh automatically.
Use Global Reports. Global Orders shows the total amount collected and the sum of refunds across every event in your organisation, and Global Transactions breaks down collected and refunded amounts per transaction.
Set a quantity for each ticket type and an overall event capacity. In Gevme, event capacity overrides individual ticket quantities, so registration closes when the combined total is reached. Add a waiting list to capture demand once tickets sell out.
Yes. Saved report settings apply to everyone who opens a report, and user roles decide who can see what, including whether a user can view Global Reports and export report data.
Review it at least once a week during sales, on the same day, against the same targets. Move to daily checks in the final two weeks and in the days after launching a campaign, then watch it live on the event day.
Conclusion: Make the Numbers Easy to Act On
A good event dashboard answers four questions at a glance: how many people have signed up, how much money has come in, how much room is left, and who has arrived. Set targets before sales open, check the same numbers on the same day each week, and agree what each warning sign triggers. The aim is to spot problems while there is still time to fix them.
Gevme Registration gives you every layer of that view: event reports with saved filters and headline aggregations, smart lists that update on their own, Global Reports across your whole programme, capacity controls that stop overselling, and a BI Dashboard for live sign up and check-in tracking. To see how it would look for your next event, request a demo and the Gevme team will walk you through it.